Analytics and measurements
Compass connects to analytics providers without becoming a raw-event analytics platform. Define a reusable metric, link it to a product record, and refresh an observation when you need evidence for a decision.
Observations do not automatically conclude experiments, change roadmap status, or update a key result's current value. Your result notes and check-ins remain the place to interpret what happened.
Connect Vercel
A workspace administrator manages the connection in Settings → Analytics. Enter the Vercel project ID, the team ID for a team-owned project, and an access token with access to that project. Compass validates access before saving. Web Analytics must be enabled for the project, and the Vercel plan must support the requested data.
Tokens are encrypted on the server and are never returned by the metrics tools. Replacing a token validates the replacement. Disconnecting removes the credential while preserving previously captured evidence.
Compass queries production data through Vercel's documented aggregate API. It does not accept arbitrary provider URLs or raw query expressions. See Vercel's API guide for provider prerequisites and reporting limits.
Settings no longer defines or edits metrics — that moved to the Metrics page below.
The Metrics dashboard
Metrics (in the main workspace navigation, alongside Discovery, Experiments, Roadmap, and OKRs) is the one place to see every metric a workspace has defined: what's fresh, what needs attention, and what it's linked to. This is also where metrics are created, edited, and archived — those actions moved off the Settings page entirely so Settings only manages the Vercel connection itself.
The page is a grid of widget cards, one per metric. A summary strip above the grid totals metrics, how many are fresh, and how many need attention (stale or failed — never a silent zero, matching the status rules below).
Each card shows, depending on its size:
- Small — status and current value only.
- Medium — adds the change versus the previous observation (or, for a comparison-mode binding, versus its baseline) and a sparkline.
- Large — adds the record(s) this metric is linked to, as clickable chips that open that experiment, key result, or roadmap item.
Drag a card by its header to reorder the dashboard; drag its bottom-right corner to resize it freely, or use the ⋯ card menu for quick S/M/L presets. The same menu edits the metric, removes it from the dashboard (the definition and its history are kept — use Add widget at the end of the grid to bring it back), or archives it.
Select the refresh icon on a card to capture a fresh observation for it without leaving the page; Refresh all (next to New metric) does the same for every shown metric, one at a time. A card refreshes the measurement that drives its headline number: the tracking link when there is one, otherwise the most recently updated link. A metric that is not yet linked to an experiment, roadmap item, or key result has nothing to refresh into, so its icon is disabled. If a refresh fails, the alert names the metric and the card shows the recorded failure; the previous value is kept, never replaced with zero. Refreshing is still manual — there is no background polling.
Dashboard layout (which metrics are shown, their size, and their order) is a workspace-level setting: everyone viewing the workspace sees the same arrangement, consistent with the rest of Compass having no per-user board personalization.
Define a metric
Metrics have a name, unit, provider, and structured query. The Vercel adapter supports pageviews, daily visitors, and named custom-event counts. Optional filters narrow paths, event properties, and feature flags.
Daily visitors are a daily series—not a count of distinct people across the entire comparison period. Adding daily visitors together would count returning visitors repeatedly, so Compass does not present that sum as period-unique users.
Edits create a new definition revision. Existing links and observations keep their original revision so a later filter change cannot silently rewrite the meaning of earlier evidence. Archive a metric when it should no longer be used for new links; its dashboard widget and all existing bindings disappear from active use but nothing is deleted.
Attach evidence to product work
Use Measurements on an experiment, roadmap item, or key result to link a metric. Track over time is the default: choose a metric and link it without entering dates or a baseline. Vercel tracking uses the last 30 completed UTC days by default; you can choose 7 or 90 days instead. The window advances when you manually refresh, not while viewing saved evidence.
Tracking shows the current measurement and available daily values without inventing a baseline or percentage change. Daily visitor values remain separate daily counts, never a period-unique total. Missing days are not zero.
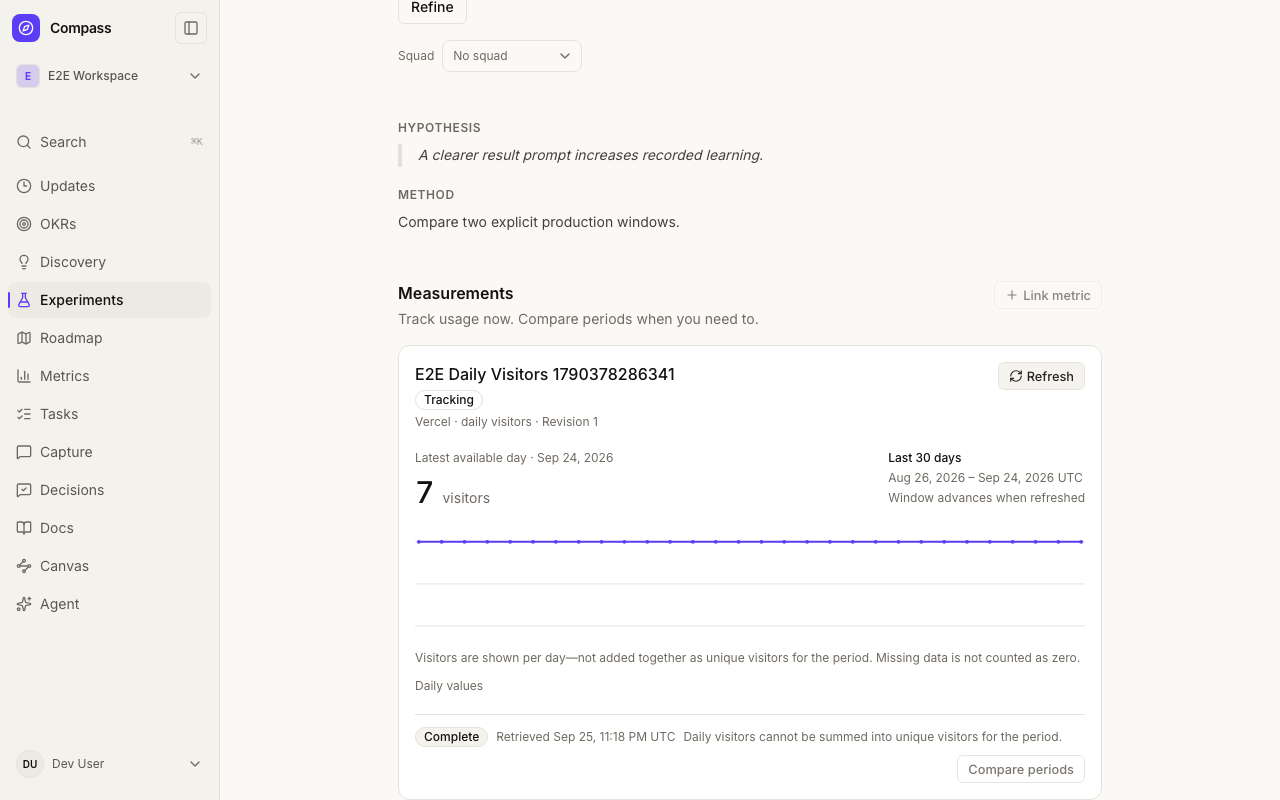
When you have a meaningful baseline, choose Compare periods and enter baseline and follow-up dates. Dates are inclusive UTC calendar dates, with each period limited to 1–90 days. Both dates must be present and the end must not precede the start. You can also use Compare periods on an existing tracking measurement.
Use the actual launch or experiment dates—not a roadmap due date assumed to be a launch. Keep populations and comparison windows comparable, and account for seasonality or other changes when interpreting a difference.
Refresh records a new observation. The observation includes its source, definition revision, query, measurement window, retrieval time, and coverage. Refreshing is manual in this release; there is no background polling schedule.
Bindings and observations are generated evidence, not editable product copy. Editing a binding's baseline, follow-up, or target value uses replacement semantics: Compass retires the active binding and creates a new one pinned to the same metric revision and product record. A no-op keeps the same binding ID. Existing observations stay on the retired binding and cannot be updated; this immutable-evidence exception is why the API intentionally has no observation update operation.
Read the status, not just the number
- Complete: the provider returned a usable observation for the requested period.
- Partial: the observation has limited coverage, such as an unfinished day or activation collection warm-up.
- Unavailable: the requested evidence cannot be established. This is not zero.
- Refresh failed: the previous observation remains available with its original retrieval time; it is not silently replaced with zero.
A provider response is evidence of observed usage, not proof that a launch caused the change. In particular, visitor counts do not establish workspace activation or retention.
The Metrics dashboard's card status (Fresh, Stale, Failed) is a workspace-wide summary of this same evidence — is there a recent successful observation for this metric, an aging one, or a failing refresh — not a replacement for the completeness detail above. A failed or stale refresh always shows as unavailable/stale on its card, never as a zero.
Active Discovery Teams
The built-in Compass activation provider measures eligible production workspaces with meaningful saved work in all three layers within the trailing 30 days:
| Layer | Examples of qualifying work |
|---|---|
| Discovery | Create an opportunity or solution; change substantive content or lifecycle state |
| Delivery | Create or promote a roadmap item; change its horizon or product links |
| Learning | Create, start, or conclude an experiment; record a result or key-result check-in |
Both authorized human and agent actions count. Views, no-op saves, reordering, imports, seeds, deletions, settings changes, and metric refreshes do not count.
This metric is an installation-wide aggregate available only in the deployment's configured operator reporting workspace. It exposes no customer workspace identities. Explicitly excluded demo and test workspaces do not count; real dogfood workspaces can count.
Collection is prospective. The first 30 days are marked as partial coverage. Compass does not infer earlier activity from generic modification timestamps. The provider produces current snapshots; historical evidence is available only where an observation was actually captured. Unsupported historical baselines remain unavailable.
Privacy and operational boundaries
Compass's own telemetry is production-only. Page paths are sanitized and sensitive routes are excluded. Qualifying server events contain low-cardinality action and source properties, not record IDs, workspace IDs, names, or user-authored content. A telemetry delivery failure must not turn successfully saved product work into a failed operation.
Connecting a provider does not enable a raw-event warehouse, arbitrary SQL execution, uploaded adapter code, automatic statistical conclusions, or scheduled synchronization. Additional adapters are compiled integrations that implement the same validation and observation contract.